Table of Contents
Definition of Quartiles
What are Quartiles?
In statistics, Quartiles are values that divide your data into quarters. They aren’t shaped like pizza slices. Quartiles divide your data into 4 segments according to where the numbers fall on the number line. The 4 quarters that divide a data set into quartiles are:
- Lowest 25% of numbers.
- Next lowest 25% of numbers up to the median.
- Second highest 25% of numbers above the median.
- Highest 25% of numbers.
You have to put the numbers in order to figure out where the quartiles are, because quartiles divide numbers up according to where their position is on the number line.
Why do we need quartiles in statistics?
They’re used to perform further calculations, for example is the interquartile range, which is a measure of how the data is spread out around the mean.
Upper Quartile
The upper quartile (also known as Q3) is the number dividing the 3rd and 4th quartile. It can also be thought of as the median of the upper half of the numbers. The upper quartile is also called the 75th percentile because it splits the lowest 75% of data from the highest 25%.
How to Find Quartiles
Quartiles are the values that divide a list of numbers into quarters:
- Put the list of numbers in order
- Then cut the list into four equal parts
- The Quartiles are at the “cuts”
6, 8, 4, 3, 6, 2, 9
Put them in order: 2, 3, 4, 6, 6, 8, 9
Cut the list into quarters:
| Q1 | Q2(Median) | Q3 | ||||
| 2 | 3 | 4 | 6 | 6 | 8 | 9 |
And the result is:
- Quartile 1 (Q1) / Lower Quartile = 3
- Quartile 2 (Q2) / middle Quartile, which is also the Median, = 6
- Quartile 3 (Q3) / upper Quartile = 8
Quartile Between 2 Numbers
Sometimes the “cut” is between 2 numbers.
The Quartile is the average of those 2 numbers.
1, 2, 2, 3, 4, 5, 5, 6, 7, 7
The numbers are already in order
Cut the list into quarters:
| Q1 | Q2(Median) | Q3 | ||||||||
| 1 | 2 | 2 | 3 | 4 | 5 | 5 | 6 | 7 | 7 |
In this case Quartile 2 is half way between 4 and 5:
Q2 = (4+5)/2 = 4.5
And the result is:
- Quartile 1 (Q1) = 2
- Quartile 2 (Q2) = 4.5
- Quartile 3 (Q3) = 6
Interquartile Range
The “Interquartile Range” is from Q1 to Q3.
To calculate it just subtract Quartile 1 from Quartile 3
Interquartile Range = Q3 – Q1
| Q1 | Q2(Median) | Q3 | ||||
| 2 | 3 | 4 | 6 | 6 | 8 | 9 |
The Interquartile Range is = Q3 − Q1 = 8 − 3 = 5
Quartile Function in Excel
You can find a quartile in Microsoft Excel using the Excel quartile function.
Type your data into a single column. (For example, type your data into cells A1 to A10)
Click an empty cell somewhere on the sheet. (For example, click cell B1)
Type “=QUARTILE(A1:A10,1)” and then press “Enter”. (This finds the first quartile. To find the third quartile, type “=QUARTILE(A1:A10,3)”)
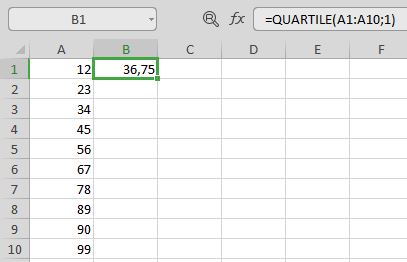
Note: If your data is in a different cell range other than A1:A10, make sure you change the function to reflect that.